

Medical billing KPIs show a practice where revenue is leaking before the bank balance does. Reworking one denied claim costs about $25 in staff time, and a formal appeal runs closer to $118, based on MGMA and HFMA figures. Payers are also denying more: Kodiak Solutions reported an average initial denial rate of 11.6% in 2025, up from 11.4% the year before.
This guide covers the nine KPIs that matter most for physician practices and outpatient groups. For each one you get the 2026 benchmark, the formula, the number that should worry you, and how often to review it.
Why Tracking These KPIs Matters
A KPI turns a vague worry like “collections feel slow” into a number one person owns. Tracked the same way every month, it shows whether a process change actually changed the result.
In practical terms, a billing KPI is a measurable value tied to one step of the revenue cycle, with a written formula, a benchmark, and an owner. The formula matters more than most practices realize. Take a visit billed at $200 that the payer allows at $100. If the practice collects the full $100, its gross collection rate is 50% and its net collection rate is 100%. Same visit, same money, two very different stories.
Consistency is what makes a KPI useful. Use the same formula, the same date range, and the same data source each period. Front-end KPIs such as eligibility verification and charge lag predict problems. Collection KPIs such as net collection rate and bad debt confirm them after the money is gone. A useful dashboard tracks both.
Medical Billing KPIs Every Practice Should Track
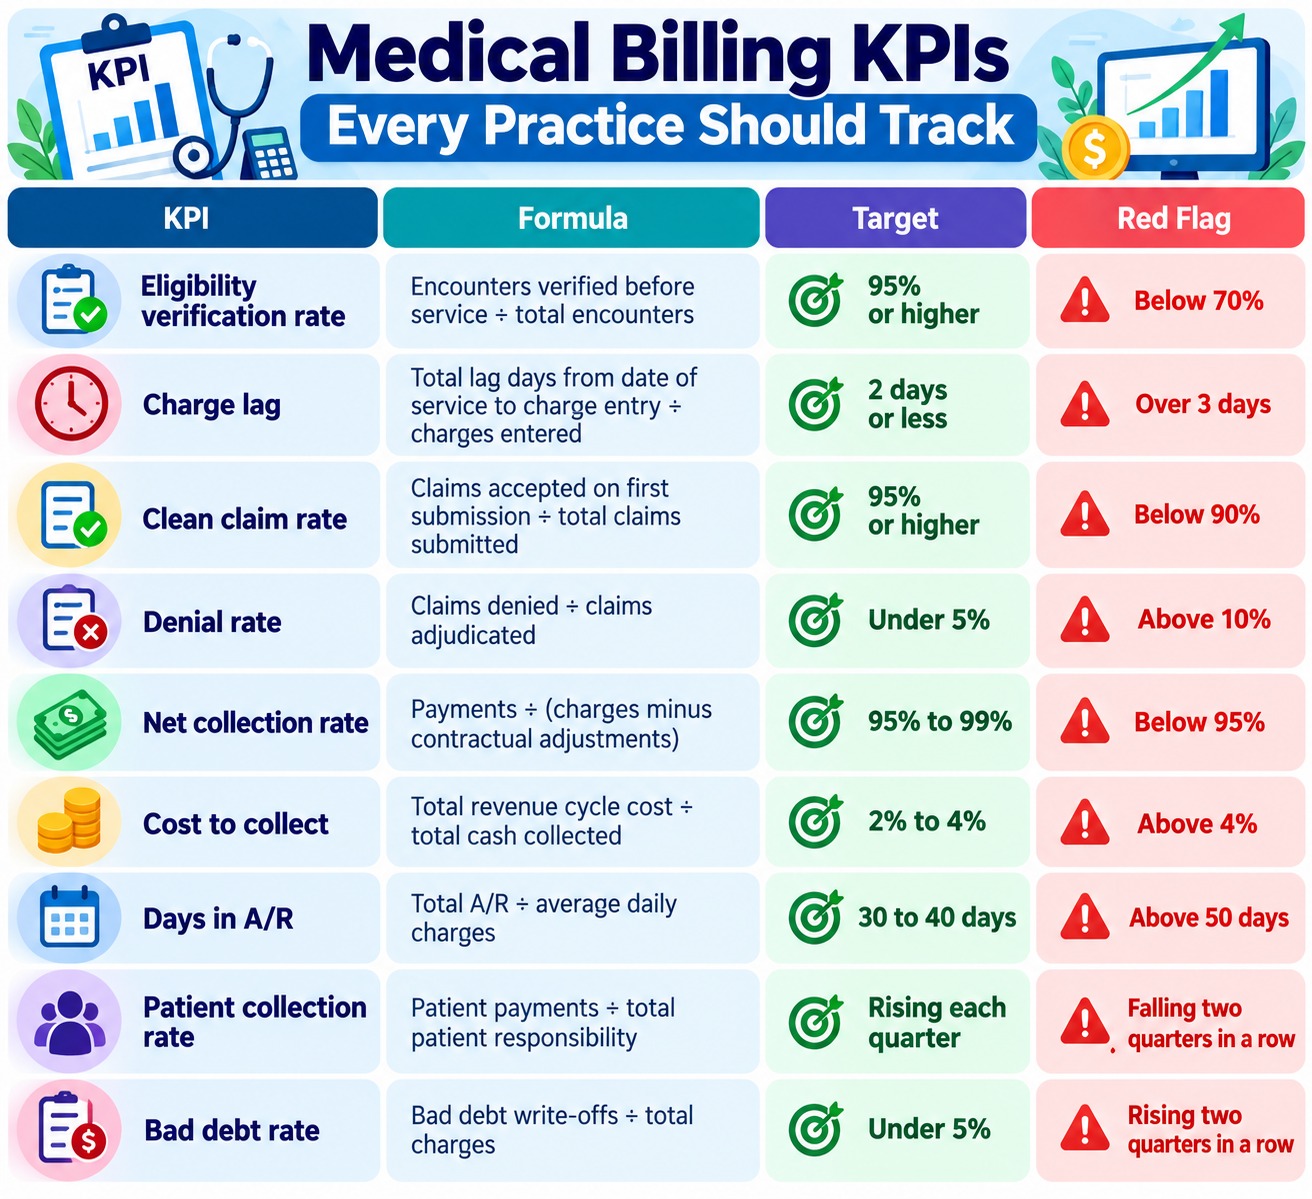
Nine KPIs cover the full revenue cycle for most practices: two front end measures, four claims and collections measures, two patient responsibility measures, and days in A/R as the overall speed check. The table below lists each one with its formula and benchmark.
If you track nothing today, start with three medical billing KPIs: clean claim rate, denial rate, and net collection rate. Clean claim rate measures the quality of what leaves the practice. Denial rate measures what payers push back. Net collection rate measures what the practice keeps. Together they show whether a revenue problem starts at the front desk, in coding, or in follow-up.
| Not sure where your numbers stand?
A Free Billing Audit compares your clean claim rate, denial rate, and net collection rate against these benchmarks using your own claims data. |
Front End KPIs That Prevent Problems Downstream
Eligibility verification rate and charge lag are the two KPIs practices skip most often. Both set a ceiling on every claims metric that follows, because a claim built on the wrong coverage or entered late cannot be fixed by better follow-up.
Eligibility Verification Rate
Eligibility verification rate is the share of encounters with coverage confirmed before the patient is seen. HFMA tracks it as a MAP Key called the insurance verification rate. The common target is 95% or more of encounters verified before service, and a rate below 70% almost guarantees eligibility denials later.
Most practices verify through a real-time 270 inquiry and the payer’s 271 response. Verify at scheduling, then again shortly before the visit for returning patients, since coverage often changes at the start of a month or plan year. Our insurance eligibility verification team runs this check before every visit.
Charge Lag
Charge lag is the average number of days between the date of service and charge entry. The MGMA and AAFP standard is two days or less. Every extra day of charge lag adds a day to the time it takes to get paid, because the payer cannot start processing a claim it has not received.
Measure charge lag by provider. The delay usually sits with a few providers who leave notes unsigned, and a practice average hides it. Long lags also put claims at risk of timely filing denials, since some commercial payers allow as little as 90 days from the date of service. A dedicated charge entry workflow keeps this number inside the two day target.
Claims and Collections KPIs
These four KPIs show how cleanly claims leave the practice, how often payers deny them, how much of the allowed amount the practice keeps, and what it costs to collect it.
- Clean claim rate. The share of claims accepted on first submission with no edits or rejections. Aim for 95% or higher. A clean claim rate below 90% points to a front-end problem, usually eligibility, missing authorizations, or coding edits. The clean claim rate is measured before adjudication. The first-pass resolution rate is the related measure of claims paid on the first pass.
- Denial rate. The share of adjudicated claims a payer denies. The target is under 5%, and best-in-class practices run 2% to 3%. The 2025 average initial denial rate of 11.6% across Kodiak’s hospital and physician data shows how far most organizations sit from that target. Read denials by category. Kodiak put request for information denials at 3.6% and clinical denials at 2.6% in 2025, and each category has a different fix. Our denial management team groups every denial by CARC and RARC code for that reason.
- Net collection rate. Payments divided by charges minus contractual adjustments. MGMA treats 95% as the minimum, and HFMA places the optimal range at 97% to 99%. Check net collection rate by payer each quarter. A blended rate of 96% can hide one payer paying 88%. The calculation is only as good as the contract rates loaded in your system.
- Cost to collect. HFMA defines it as total revenue cycle cost divided by total patient service cash collected. The typical range is 2% to 4%, and a figure above 4% deserves a review. Count every input: billing staff, software, clearinghouse fees, statement printing, and any vendor fees.
Days in A/R ties these four together. MGMA and AAFP both point to 30 to 40 days as the healthy range, with less than 10% of receivables older than 90 days. Our A/R recovery team works the aging buckets that push this number up.
Patient Responsibility KPIs
Patients now owe a larger share of each bill, and that share is harder to collect. Patient collection rate and bad debt rate show how much of it actually reaches the practice.
Patient Collection Rate
Patient collection rate is patient payments divided by total patient responsibility. Kodiak Solutions found that providers collected 34.5% of what insured patients owed in 2024, down from 37.6% in 2023. Track your own rate by quarter and aim for steady improvement.
The biggest gains come before the visit. Give patients a cost estimate when you verify eligibility, collect copays and known balances at check-in, and issue a good faith estimate to uninsured and self-pay patients as the No Surprises Act requires. Online payment and short statement cycles help with balances left after the claim pays.
Bad Debt Rate
Bad debt rate is the share of charges written off as uncollectible patient balances. Keep it under 5%. Separate patient bad debt from denial write-offs, which HFMA tracks as a different measure, so a coding problem does not show up as a patient payment problem. If bad debt rises while patient collection rate stays flat, review your write-off policy before you change your statements. Our patient billing services handle statements, payment plans, and balance follow-up.
How Often to Review These KPIs
Review front-end and denial KPIs weekly, collection KPIs monthly, cost and payer performance quarterly, and targets once a year. Faster-moving numbers need shorter cycles because they can be fixed in the same week they slip.
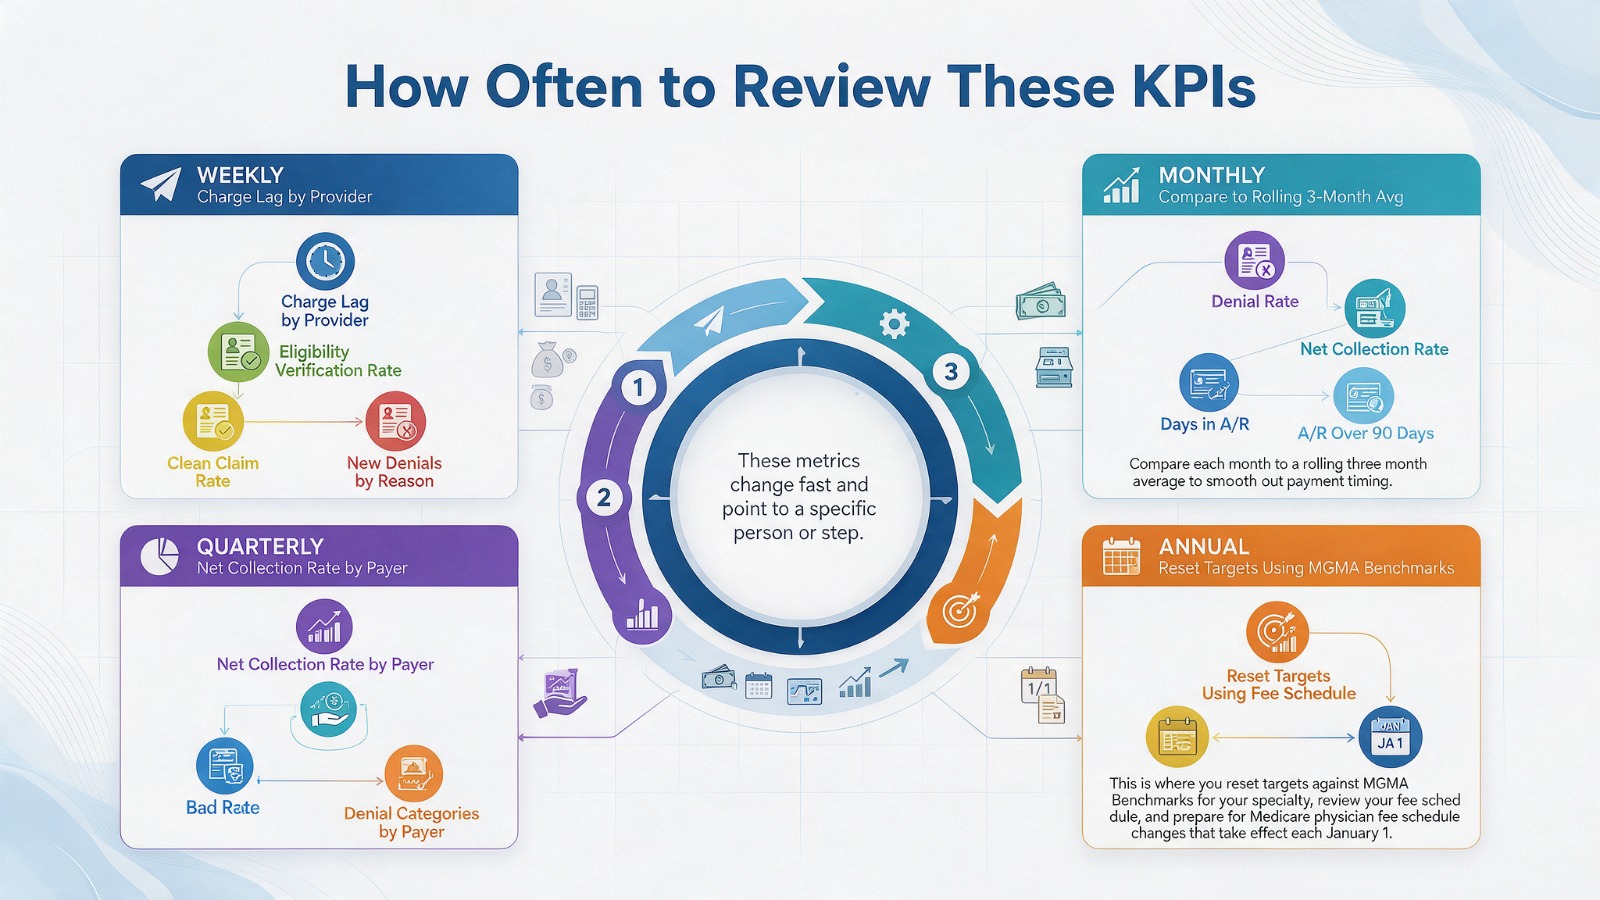
Assign one owner to each KPI and keep a written definition of every formula. If two people calculate a KPI two different ways, you’ll get two answers.
How RCM Xpert Helps Practices Track and Improve These KPIs
RCM Xpert reports these medical billing KPIs monthly and manages the processes behind them, from eligibility checks before the visit to patient balance follow-up after the claim pays.
- Monthly KPI reporting: Every KPI in this guide, calculated with the formulas above and broken out by provider and payer.
- Front-end accuracy checks: Eligibility verification before each visit and charge entry inside the two-day target.
- Denial tracking by cause: Every denial grouped by CARC and RARC code, with appeals filed and root causes fixed upstream.
- Patient collection support: Clear statements, payment plans, and balance follow-up that lift patient collection rate.
| Your denials have a pattern. We will find it.
A Free Billing Audit reviews your last 90 days of claims and shows which KPIs are below benchmark and why. |
Frequently Asked Questions
What are the most important medical billing KPIs to start with?
Start with clean claim rate, denial rate, and net collection rate. Clean claim rate measures the quality of claims leaving the practice, denial rate measures what payers push back, and net collection rate measures how much of the allowed amount you keep. Add days in A/R and charge lag next.
What is a good clean claim rate?
A good clean claim rate is 95% or higher, meaning at least 95 of every 100 claims are accepted on first submission without edits or rejections. A rate below 90% usually points to eligibility errors, missing prior authorizations, or coding edits at the front end.
What is considered a healthy denial rate?
A healthy denial rate is under 5%, and best-in-class practices hold it at 2% to 3%. The 2025 average initial denial rate was 11.6%, according to Kodiak Solutions, so most organizations have room to improve. Anything above 10% calls for a review by denial category.
What is net collection rate and why does it matter?
Net collection rate is payments divided by charges minus contractual adjustments. It shows how much of the money you are contractually owed you actually collect. MGMA treats 95% as the minimum, and HFMA places the optimal range at 97% to 99%.
What is the difference between gross and net collection rate?
Gross collection rate divides payments by total billed charges, so it depends on how high your fee schedule is set. Net collection rate divides payments by the allowed amount after contractual adjustments. Net collection rate is the better measure of billing performance.
How do you calculate days in A/R?
Divide total accounts receivable by average daily charges. To get average daily charges, take gross charges for a set period, such as the last 90 days, and divide by the number of days in that period. A healthy range is 30 to 40 days.
What is a good cost to collect for a medical practice?
A typical cost to collect is 2% to 4% of cash collected. HFMA calculates it as total revenue cycle cost divided by total patient service cash collected. Include staff, software, clearinghouse fees, statements, and vendor fees. A figure above 4% deserves a closer look.
What is charge lag in medical billing?
Charge lag is the average number of days between the date of service and charge entry. The MGMA and AAFP standard is two days or less. Every extra day of charge lag delays payment and raises the risk of timely filing denials.
How often should a practice review its billing KPIs?
Review charge lag, eligibility verification, clean claim rate, and new denials weekly. Review denial rate, net collection rate, days in A/R, and patient collection rate monthly. Review payer-level collections, cost to collect, and bad debt quarterly, and reset targets once a year.
What is the difference between clean claim rate and first pass resolution rate?
Clean claim rate measures claims accepted on first submission before the payer adjudicates them. First pass resolution rate measures claims paid in full on the first submission. A claim can be clean and still be denied or underpaid, so track both.
Conclusion and Call to Action
Start with clean claim rate, denial rate, and net collection rate. Once those are steady, add days in A/R and charge lag, then build out the full set of nine medical billing KPIs. The goal is a short list of numbers your team calculates the same way every period and acts on.
| See exactly where your practice stands
Book a Free Billing Audit and get your nine KPIs measured against 2026 benchmarks, with a plan for the three that need attention first. Call 740-766-6083 or request your audit online. |
Sources
- Kodiak Solutions, State of the Healthcare Revenue Cycle (via TechTarget, April 2026)
- HFMA, Insurers and patients pay less of their bills (Kodiak 2024 data)
- HFMA, MAP Keys 2023 Edition
- Becker’s Hospital Review, How to prevent claim denials (MGMA rework cost)
- TechTarget, Breaking Down the Top 5 Healthcare Revenue Cycle KPIs
- NextGen, Month End Performance KPI Overview (MGMA and AAFP benchmarks)